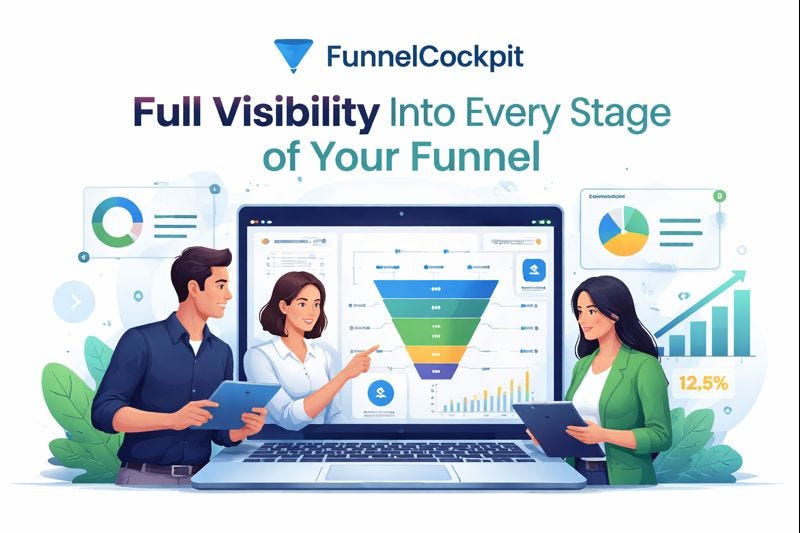
FunnelCockpit: Full Visibility Into Every Stage of Your Funnel
After more than five years working hands-on with multi-step sales funnels, analytics stacks, and revenue operations, I’ve seen the same problem repeat itself across SaaS companies, digital product businesses, and agencies:
Teams don’t lack data — they lack clarity.
Clicks, page views, opt-ins, email opens, conversions — the numbers are everywhere. Yet when revenue dips or growth stalls, the same questions surface:
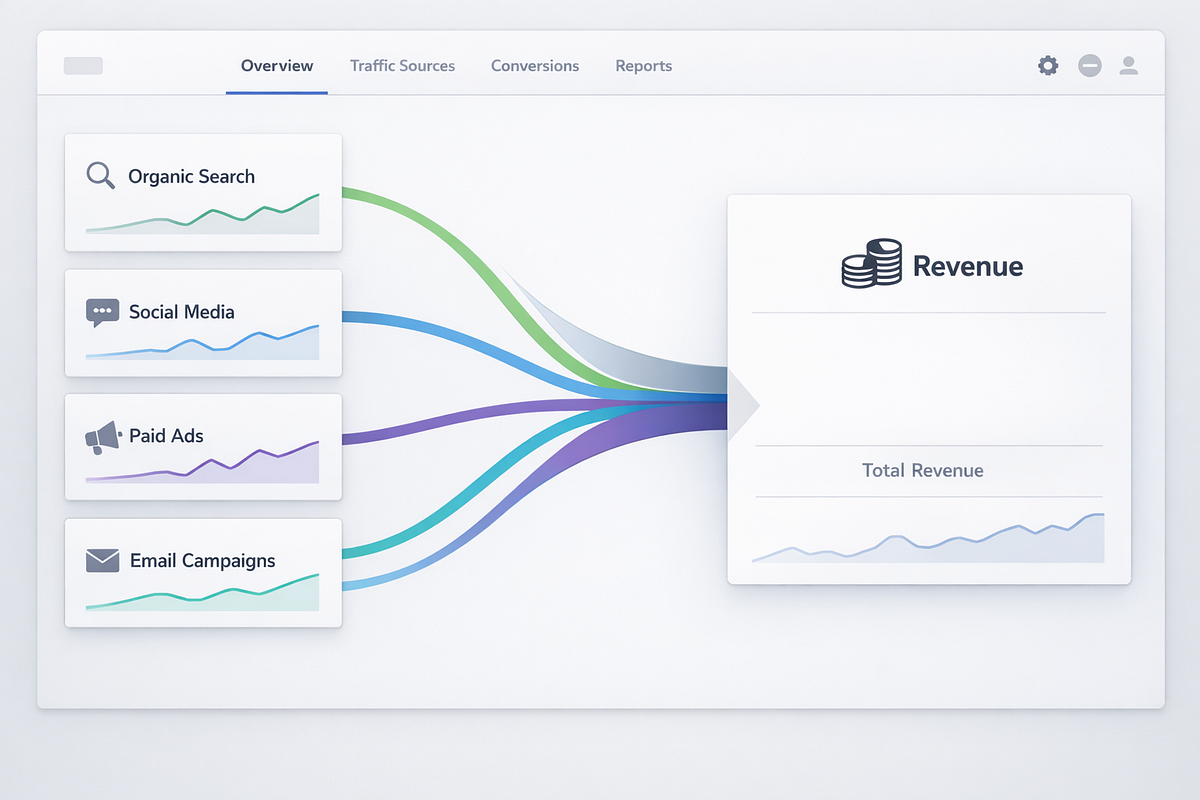
- Which traffic source is actually driving revenue?
- Where is the funnel really leaking?
- What should we optimize first to move the needle?
This is where most analytics stacks fail — and where FunnelCockpit fundamentally changes how funnel decisions are made.
This article is for founders, marketers, and revenue teams running multi-step funnels who are tired of stitching together reports from five different tools and still not knowing what’s actually driving revenue.
The Real Funnel Visibility Problem (It’s Not a Lack of Data)
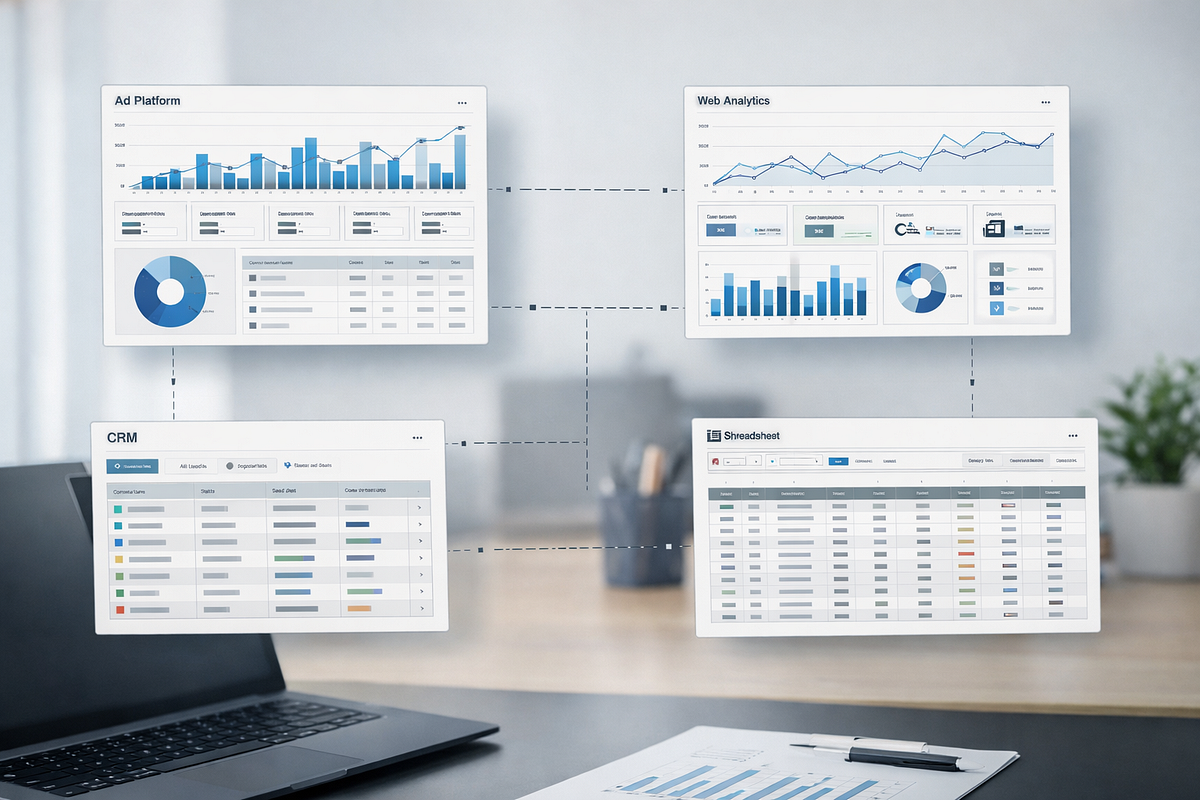
Before using FunnelCockpit with clients, the core issue was never missing tools. It was fragmentation.
A typical setup looked like this:
- Facebook, Google, or YouTube Ads for clicks and spend
- Google Analytics for sessions and events
- Funnel builders for page-level conversions
- CRMs and email tools for leads and engagement
- Stripe or PayPal for revenue
- Spreadsheets to manually reconcile everything
Each tool told a different story. None showed the full one.
The Resulting Blind Spots
- No true end-to-end visibility
We could see clicks, opt-ins, and purchases — but not how a user moved from first touch to final revenue. - Broken or misleading attribution
Last-click models ignored early funnel touchpoints. Email and retargeting were undervalued. “Winning” campaigns were scaled for the wrong reasons. - Funnel leaks were hard to diagnose
When revenue dipped, debugging felt like guesswork. Was it traffic quality? Messaging? A specific funnel step? No one could say with confidence. - Reporting lagged behind reality
By the time spreadsheets were updated, the budget was already spent.
The real problem wasn’t performance — it was the inability to clearly see what was happening at each stage of the funnel.
Common Funnel Visibility Myths That Cost Teams Money
Over the years, a few misconceptions show up again and again — and they’re expensive.
“Google Analytics already gives me full funnel visibility.”
It doesn’t.
GA tracks activity, not outcomes. It shows sessions and events but doesn’t connect traffic to revenue across tools or reveal which funnel steps actually create profit.
“If the funnel converts, visibility doesn’t matter.”
A funnel can convert while still:
- Burning money at the top
- Losing high-value users mid-funnel
- Scaling the wrong traffic sources
Without visibility, you don’t know why it works — or how fragile it is.

“Dashboards equal clarity.”
Most dashboards display surface-level KPIs. True visibility answers specific questions about revenue creation and loss. More charts don’t equal better decisions.
Funnel visibility isn’t about collecting more data — it’s about finally seeing the data that actually drives revenue.
What FunnelCockpit Actually Does Differently
FunnelCockpit gives you true end-to-end funnel visibility by unifying traffic, behavior, and revenue data into a single, actionable source of truth.
Instead of isolated metrics, you get a connected view of the entire journey.
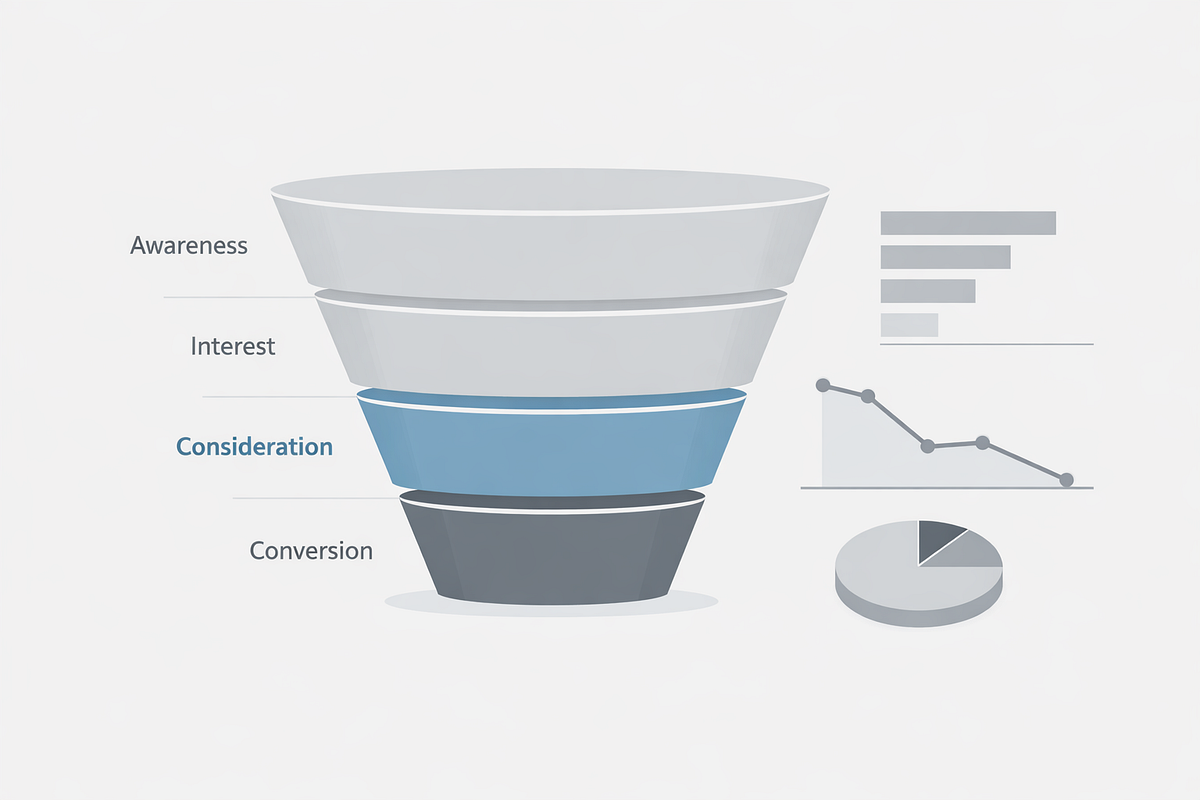
Funnel Stages FunnelCockpit Makes Unusually Clear
1. Traffic quality (before conversion happens)
You see which sources bring buyers versus browsers — not just cheap clicks.
2. Step-level drop-offs
Exact funnel steps where users exit, segmented by traffic source or campaign.
3. Revenue attribution
First click, assisted touchpoints, and final conversion are connected — so budget decisions are based on profit, not assumptions.
4. Time-to-conversion
You can see how long conversions actually take, preventing premature campaign shutdowns.
5. Full lifecycle performance
Lead → customer → revenue visibility replaces page-level vanity stats.
FunnelCockpit doesn’t just show what happened — it shows where, why, and how revenue is created or lost.
The Most Underestimated Capability: Seeing Revenue, Not Just Conversions
This is the feature users underestimate most — until they see it live.
Two funnels with identical opt-in rates can produce wildly different revenue. Early funnel steps quietly determine LTV and profitability, but most tools never surface that connection.
Once FunnelCockpit is in place, teams often realize:
- “Winning” campaigns produce low-value customers
- Strong-looking pages weaken downstream conversions
- Small upstream leaks have an outsized revenue impact
Most tools show where people click. FunnelCockpit shows where money is actually made or lost.
Real-World Decisions Changed by FunnelCockpit
Pausing a “Winning” Campaign
A Facebook Ads campaign looked strong based on clicks and opt-ins.
FunnelCockpit revealed: High lead volume, low revenue contribution.
Decision: Budget reallocated to a smaller channel producing fewer leads but significantly higher revenue.

Fixing a Costly Funnel Leak
A webinar funnel generated steady registrations, but revenue stagnated.
FunnelCockpit revealed: Major drop-off after a slow, complex upsell page.
Decision: Simplified the flow, increasing upsell conversions by 32% within a month.
Identifying High-LTV Traffic
A SaaS founder assumed Google Ads drove the best users.
FunnelCockpit revealed: LinkedIn traffic produced fewer sign-ups but the highest lifetime value.
Decision: Budget shifted, improving ROI while lowering CAC.
FunnelCockpit doesn’t just show data — it reveals insights that change decisions in real time.
Measurable Outcomes We’ve Seen
Across SaaS, ecommerce, and digital product funnels:
- 20–35% conversion lifts by fixing step-level leaks
- 15–40% CAC reductions by reallocating spend to high-LTV traffic
- 10–25% revenue recovery by addressing hidden funnel drop-offs
- Faster optimization cycles by eliminating manual reporting
These aren’t guarantees — they’re the result of acting on clear, connected data.

How I Personally Think About Funnels
I don’t see funnels as linear paths. I see them as living systems.
- System-level, not page-level
- Feedback-driven, not set-and-forget
- Modular, not fragile
- Revenue-focused, not vanity-metric-driven
Funnels fail quietly before checkout — usually due to traffic quality, mid-funnel engagement, upsells, or delayed conversions. Teams miss it because fragmented tools obscure cause-and-effect relationships.

FunnelCockpit supports this system-level approach by turning funnel data into a decision-making engine — not just another dashboard.
When FunnelCockpit Is (and Isn’t) the Right Fit
Ideal for:
- Multi-step funnels
- Paid traffic
- Revenue-driven teams
- SaaS, courses, agencies, and advanced ecommerce
Not necessary for:
- Single-page, low-traffic funnels
- Businesses without measurable revenue
- Teams unwilling to act on insights
FunnelCockpit isn’t a silver bullet. It provides clarity — results depend on execution.

The Highest-Leverage Insight You Can Act On
If you only acted on one FunnelCockpit insight, it should be this:
Identify which traffic sources and funnel steps generate the highest revenue — not the most leads.
That single shift changes how budgets are allocated, how funnels are optimized, and how growth is scaled.
Final Thought and Next Step
Fragmented analytics create confidence without understanding. Full funnel visibility creates clarity — and clarity drives better decisions.
If you’re tired of guessing where your revenue is leaking and want to see your entire funnel in one view, the next step is simple:
Explore FunnelCockpit and see how end-to-end visibility changes how you optimize, allocate budget, and grow.


Comments
Post a Comment